Connection-Based Tools for Bio-Inspired Design (Ernst-Jan Mul)

As part of my thesis in the Masters Program of Integral Product Design (Delft University of Technology), I explored how biomimicry could shape the design process by providing a compelling sustainability vision as well as the means to achieve that vision. Tools and methods are essential for a new design discipline to thrive. I reviewed the kinds of tools that could be employed in bio-inspired design and developed a model that mapped these tools to the analysis, synthesis, materialization and evaluation phases (shown below).
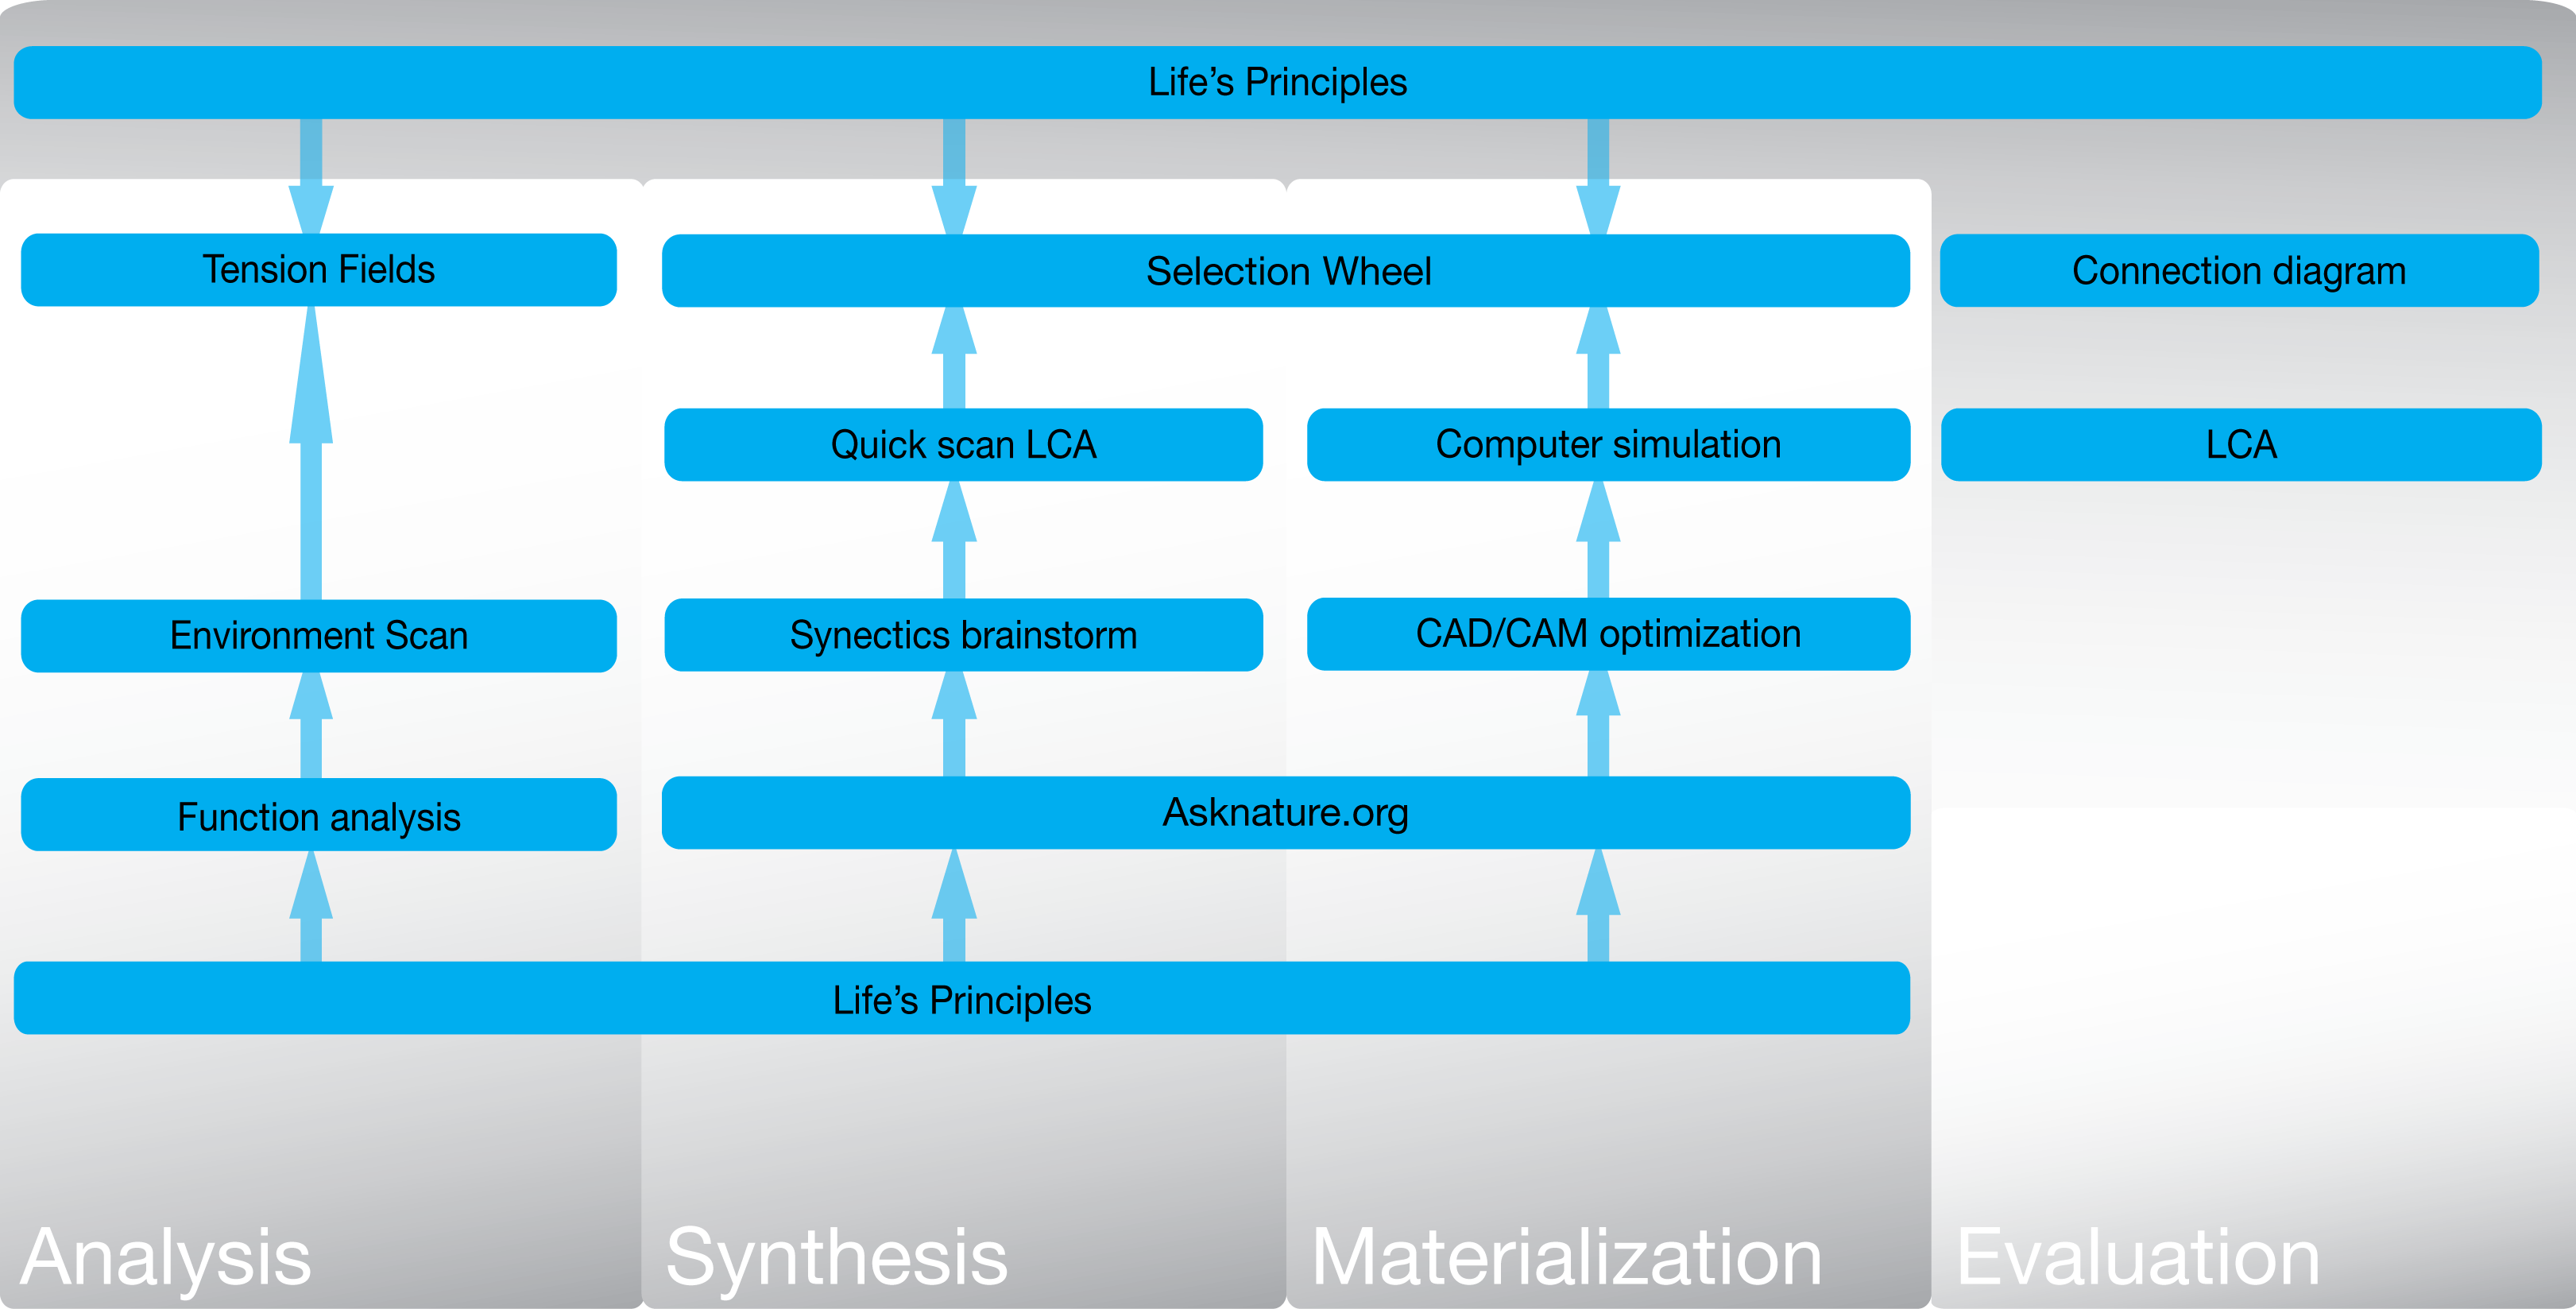
Some tools such as AskNature and the Selection Wheel are repeated because they can be used in multiple phases. The extension of the Evaluation phase across the top reflects the importance of evaluating the results of each phase, in addition to the final evaluation at the end of the project. The Life’s Principles are placed above and below the other tools, since they can be used to generate as well as evaluate ideas.
I was not able to find tools that would help operationalize the Life’s Principles "locally attuned and responsive" and "leveraging interdependence". I developed two tools to analyze and evaluate the degree of connection between a product and its direct environment.
Environment Scan Tool
The environment scan is an analysis of the direct environment of a product, at all stages of its life cycle. It is a way of mapping the landscape of a problem to identify both the challenges and the resources that could be used in a systems solution. Actors present in the environment are evaluated on three categories: energy forms, materials, and organisms. The environment scan serves as an input for the connection diagram.
Connection Diagram Tool
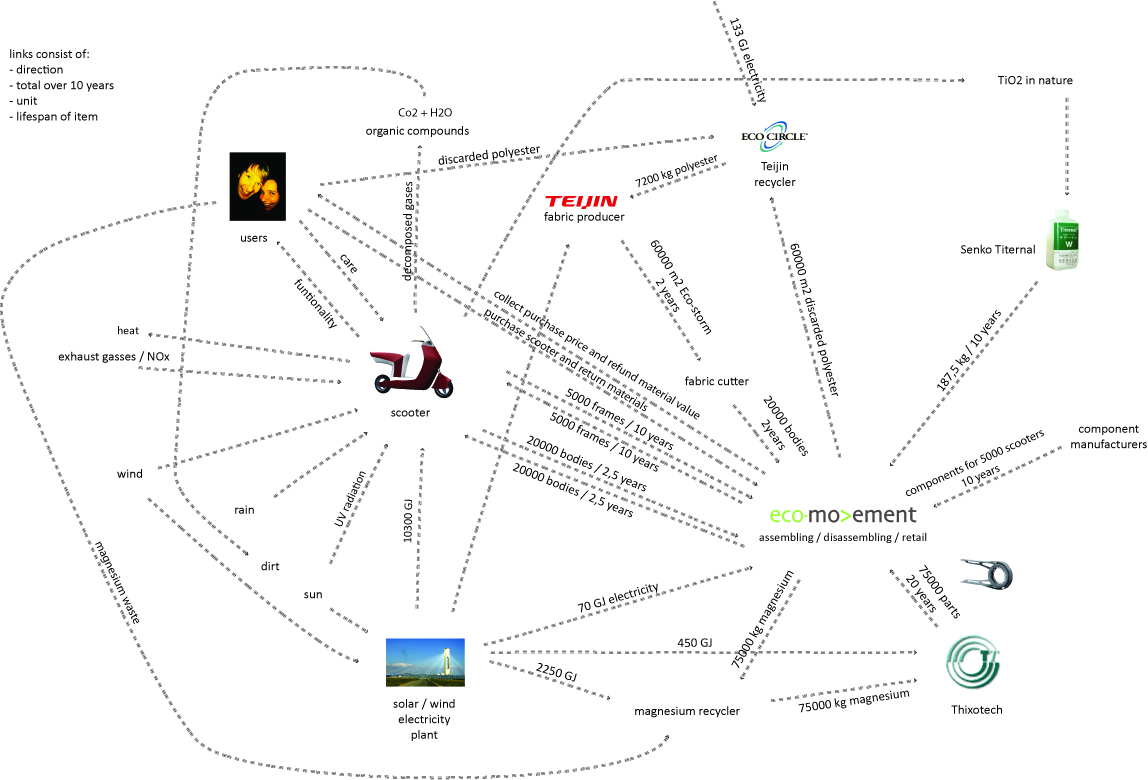
The connection diagram is a representation of the connections a product has with its environment. The nodes consist of actors, while the links represent the interactions occurring between these actors over a chosen time span. The diagram includes information about the interactions, including their direction, the units and magnitude over a chosen time span, and lifespan of the interaction.
The connection diagram as presented in the electric scooter case study (shown below) has the potential to visualize the connections a product has with its environment, the "eco" system that surrounds it. The diagram can be used to qualitatively evaluate the degree of connectivity and the number of cyclic or mutually beneficial connections. It supports introducing a means for ordinal measurement of a product’s sustainability in terms of its connectivity.
There are problems with the diagram that led to three research questions:
- The visualization is based on models of food webs. However, they tend to become unreadable as the numbers of nodes and connections increase. How can complex networks with a high number of connections best be represented?
- The quality of the connection diagram is dependent on the input of environmental data. Collecting this data is too time-consuming in the context of design projects. Can databases with environmental data be connected to an automated visualization tool?
- The connection diagram had not been tested yet with other industrial design engineers. How do industrial design engineers perceive and use the connection diagram?
A search for visualization methods of large amounts of connections lead to the Circos diagram developed to visualize connections between genomes. It creates clearly viewable graphics of high numbers of connections. The tool can be connected to existing databases, opening the possibility to create interactive diagrams of high quality data. (Krzywinski, 2011)
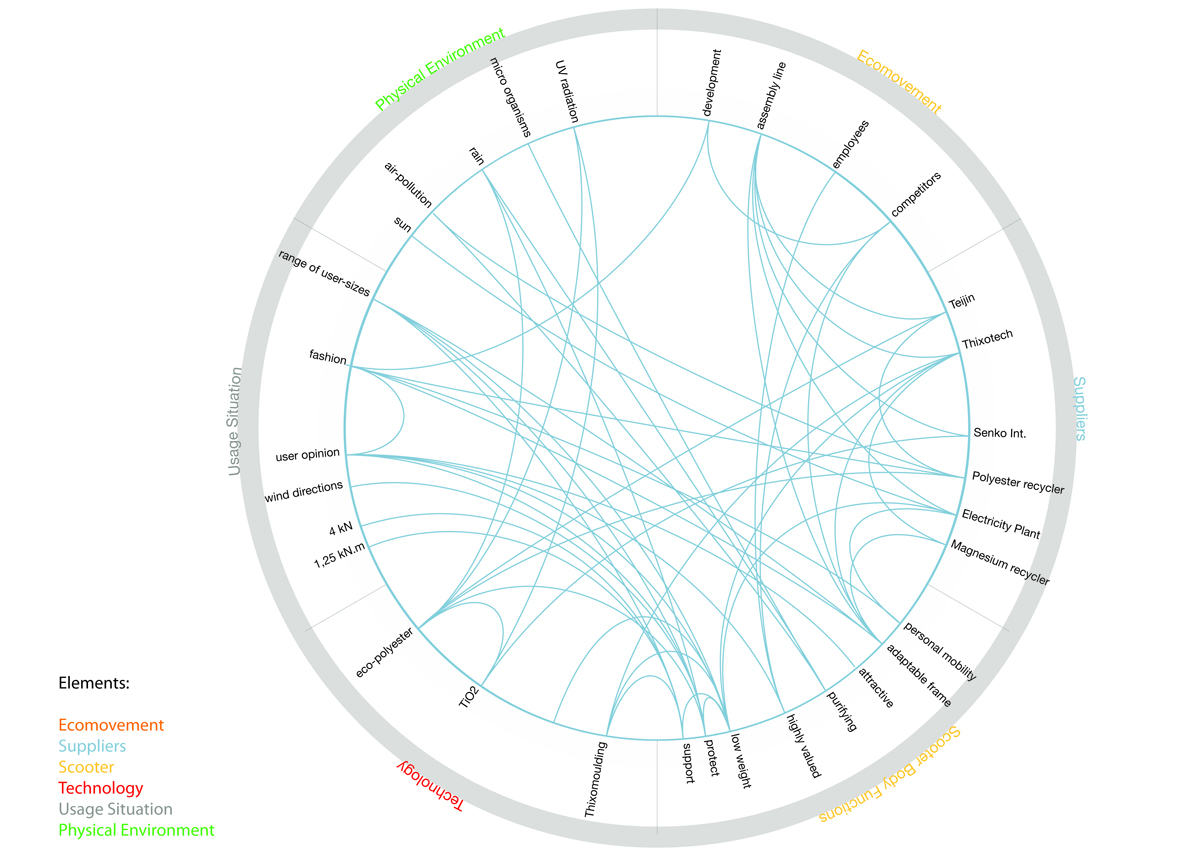 Its application to the electric scooter case study is shown at the left. Actors are arranged around the circle in the categories used in an integral development process: ecomovement, suppliers, scooter, technology and usage situation. These categories receive input from traditional analysis tools used in a product development process (Remmerswaal, et al., 2002) (Roozenburg, et al., 1998). In addition, the physical environment category receives input from the environment scan (Mul, 2010).
Only the linkages are shown: other information (direction, magnitude, lifespan) is omitted to focus attention on the connectivity of the product. In a later stage of development of the tool this information will be integrated into the diagram.
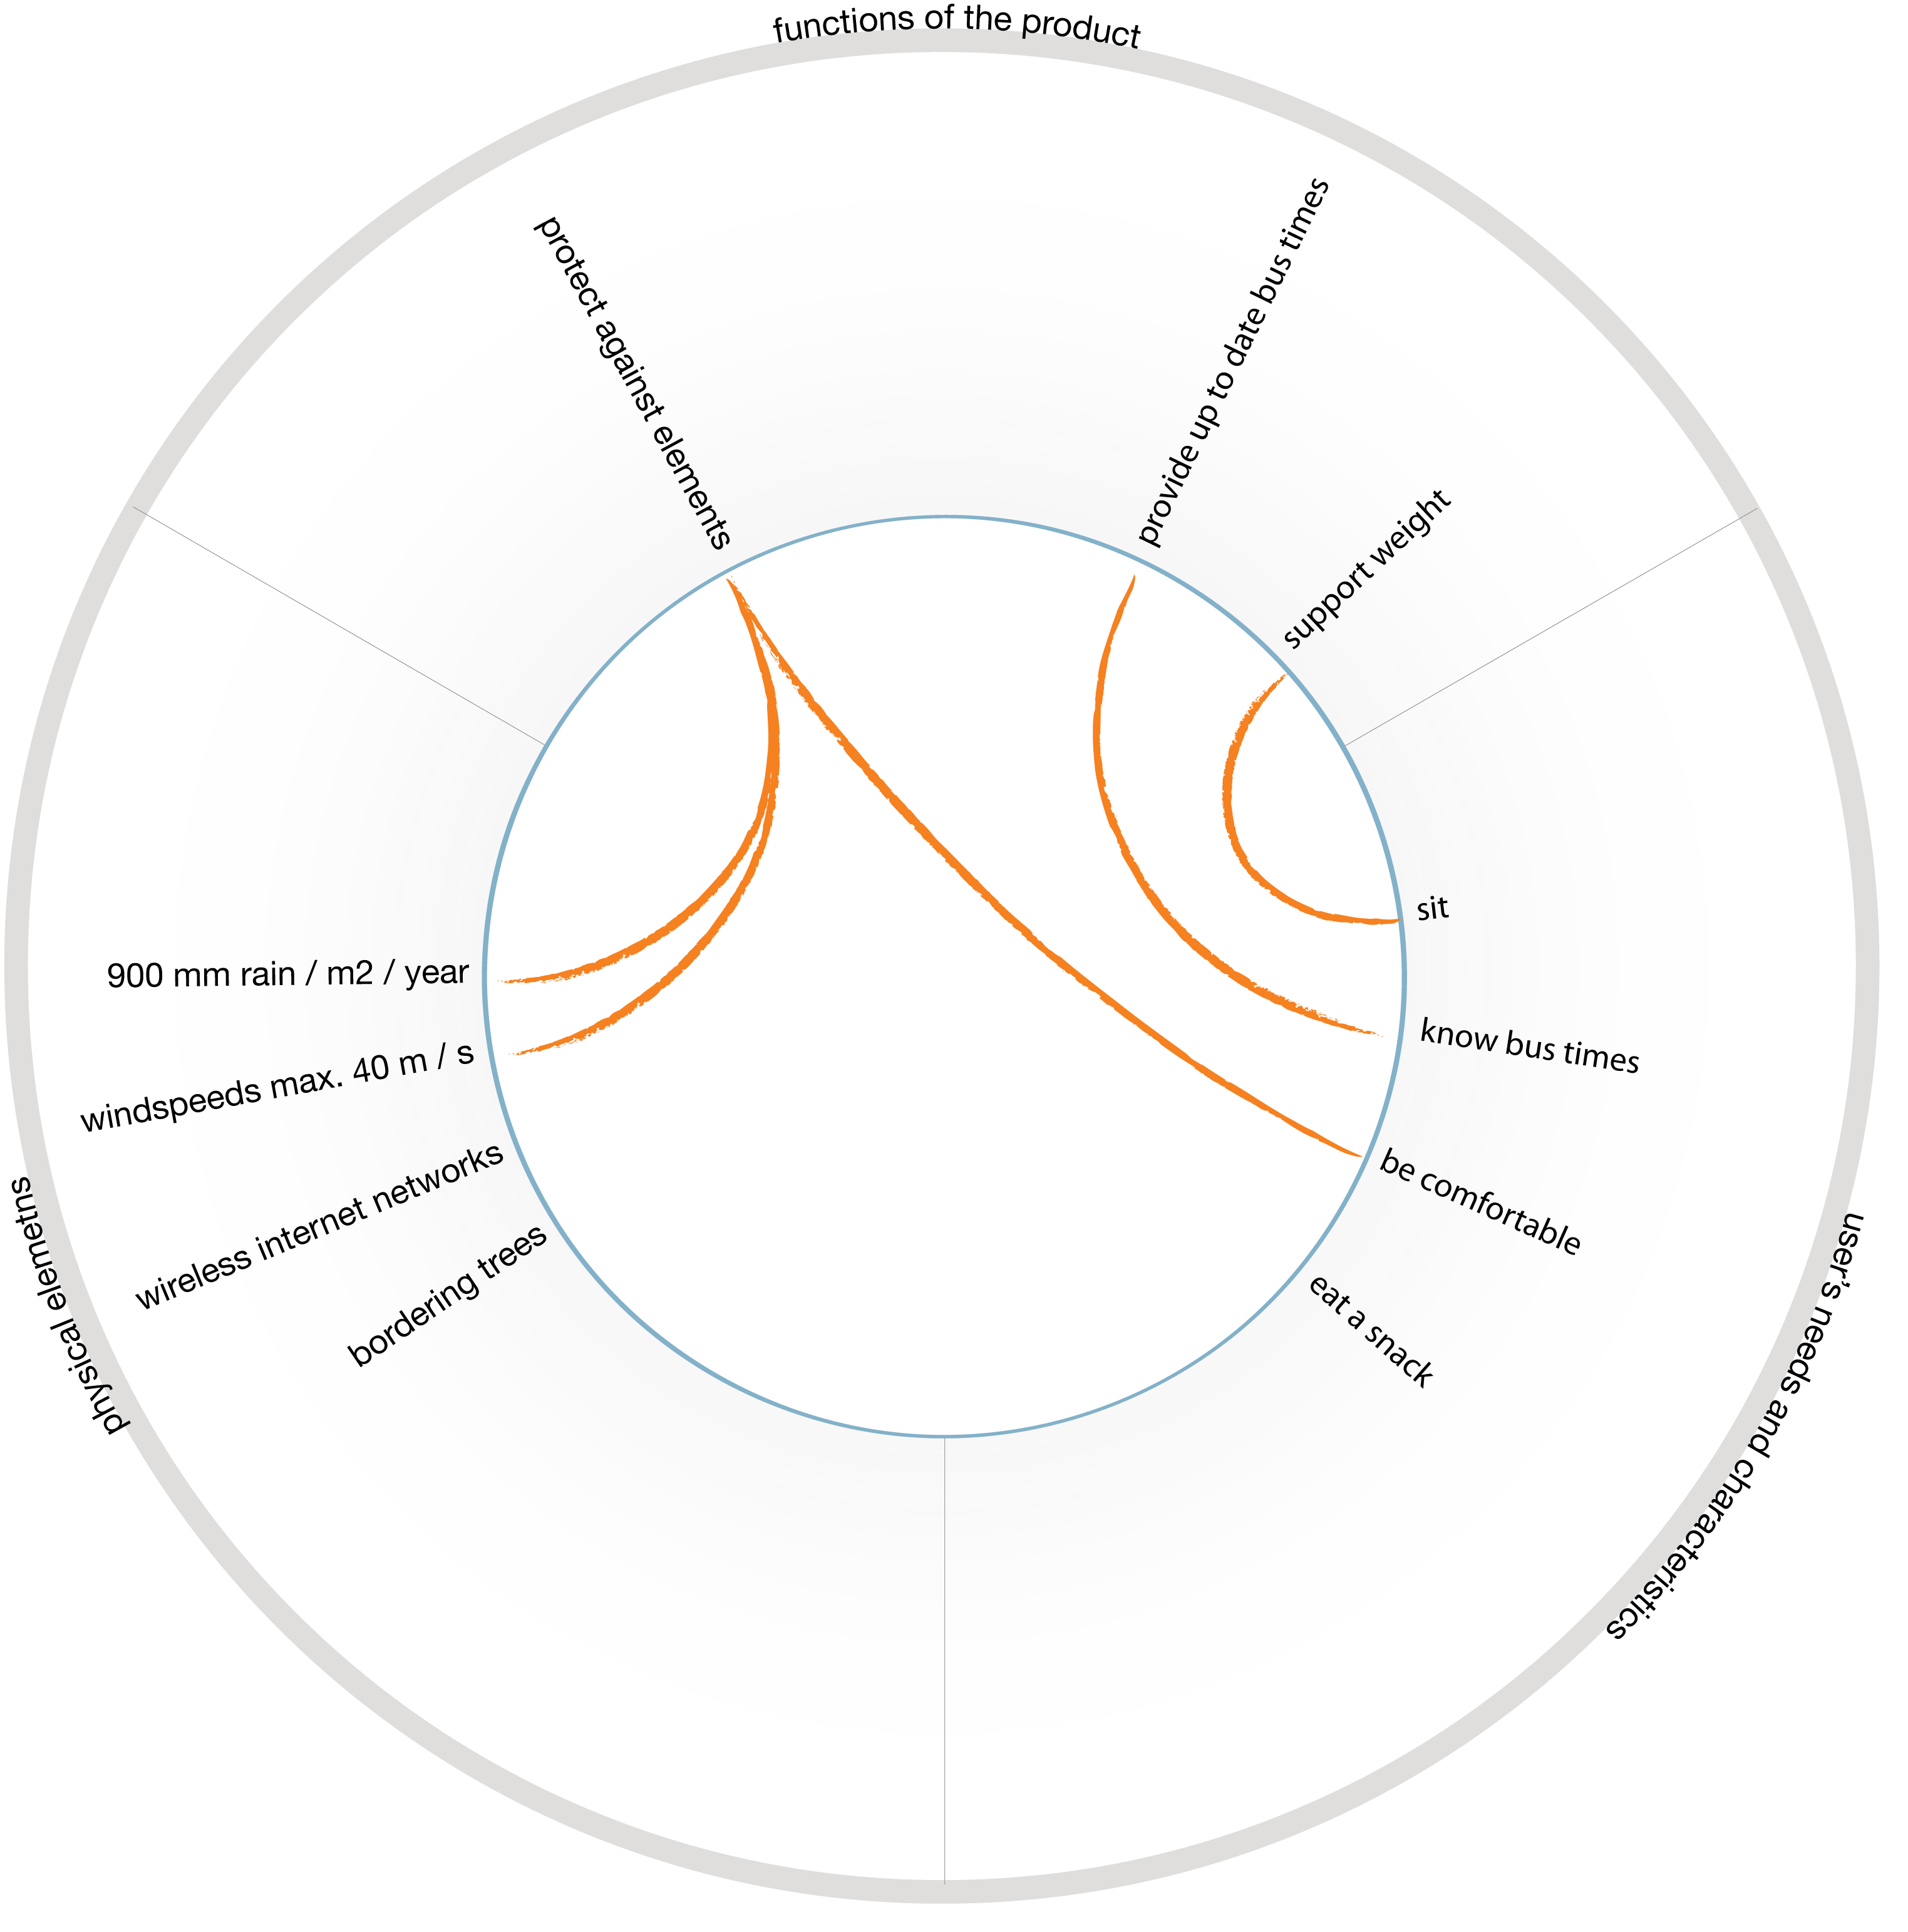
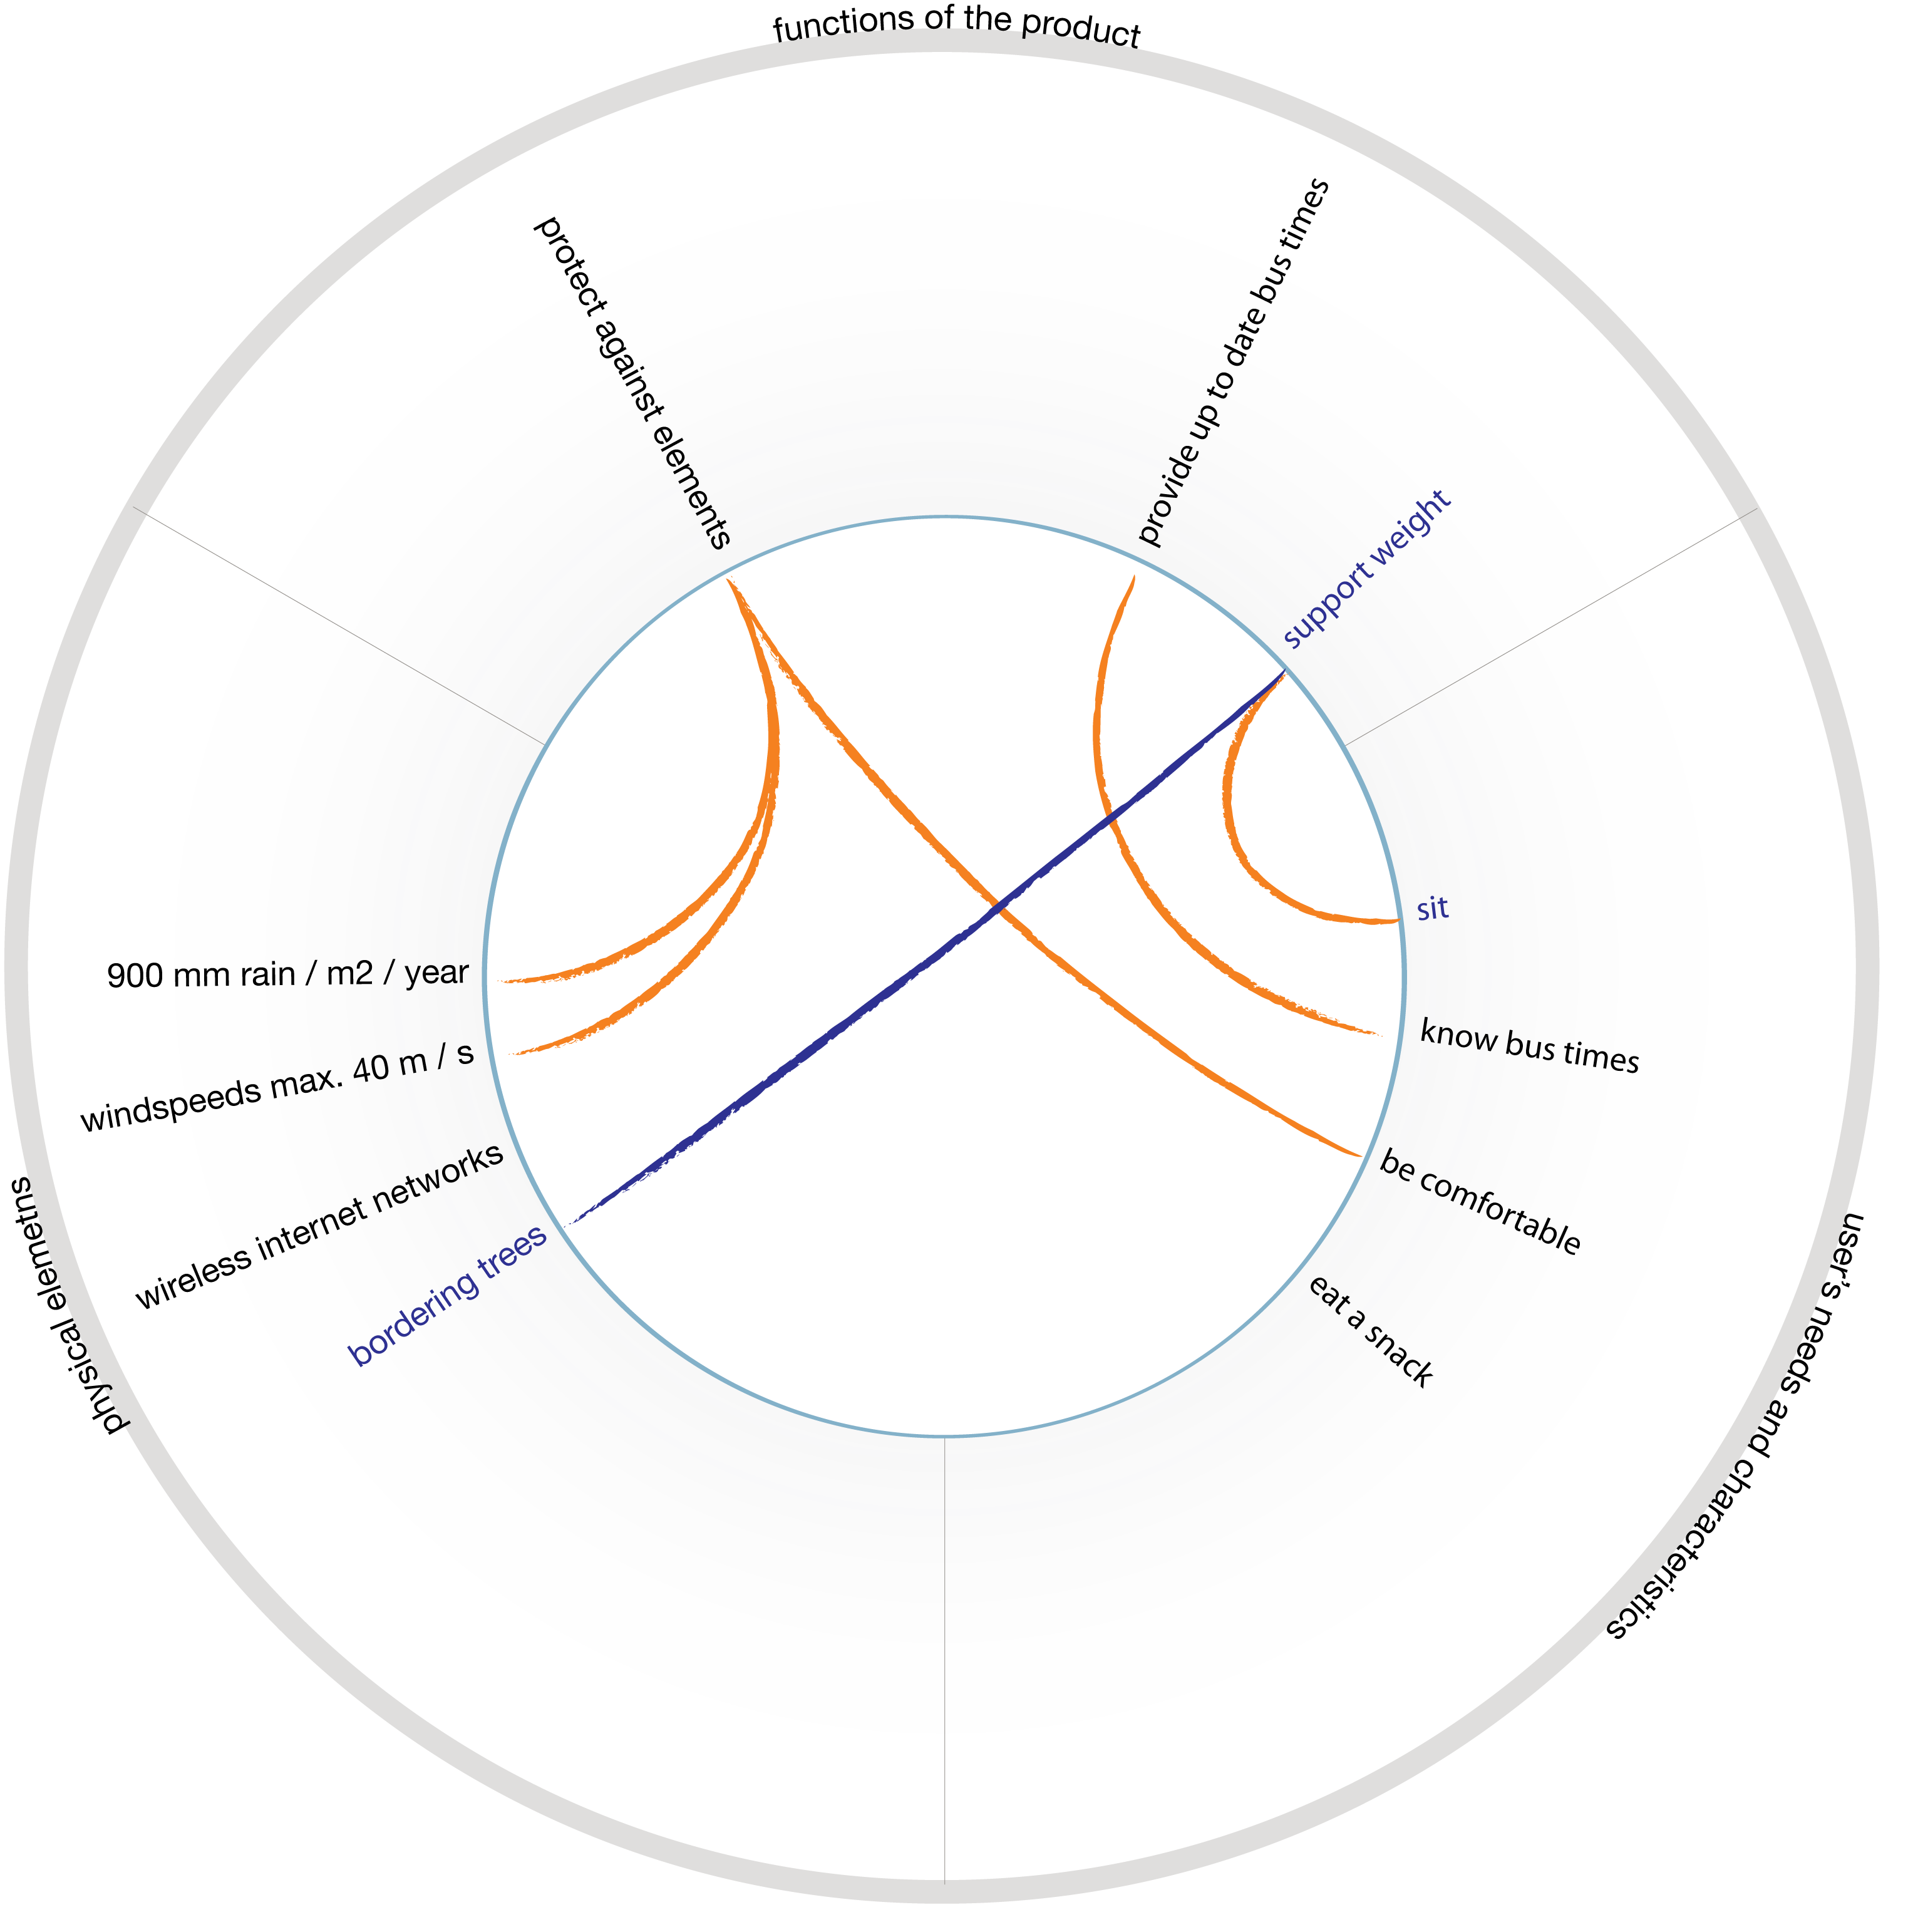
A simplified example of a Dutch bus stop will illustrate how the connection diagram is developed and used in the analysis phase to visually summarize the relevant elements that influence the design of the product.
- Divide the circle in a number of sections equal to the number of categories with which the environment is described. In this case, the categories Functions of the product, User’s needs and characteristics, and Physical Elements are used.
- Place the elements of each category along the circle within their segment, using input from function analysis, usage and ergonomics analysis and the Environment Scan respectively.
- Draw lines between elements that are known to have interactions. Interactions can be exchanges of energy, materials, information.
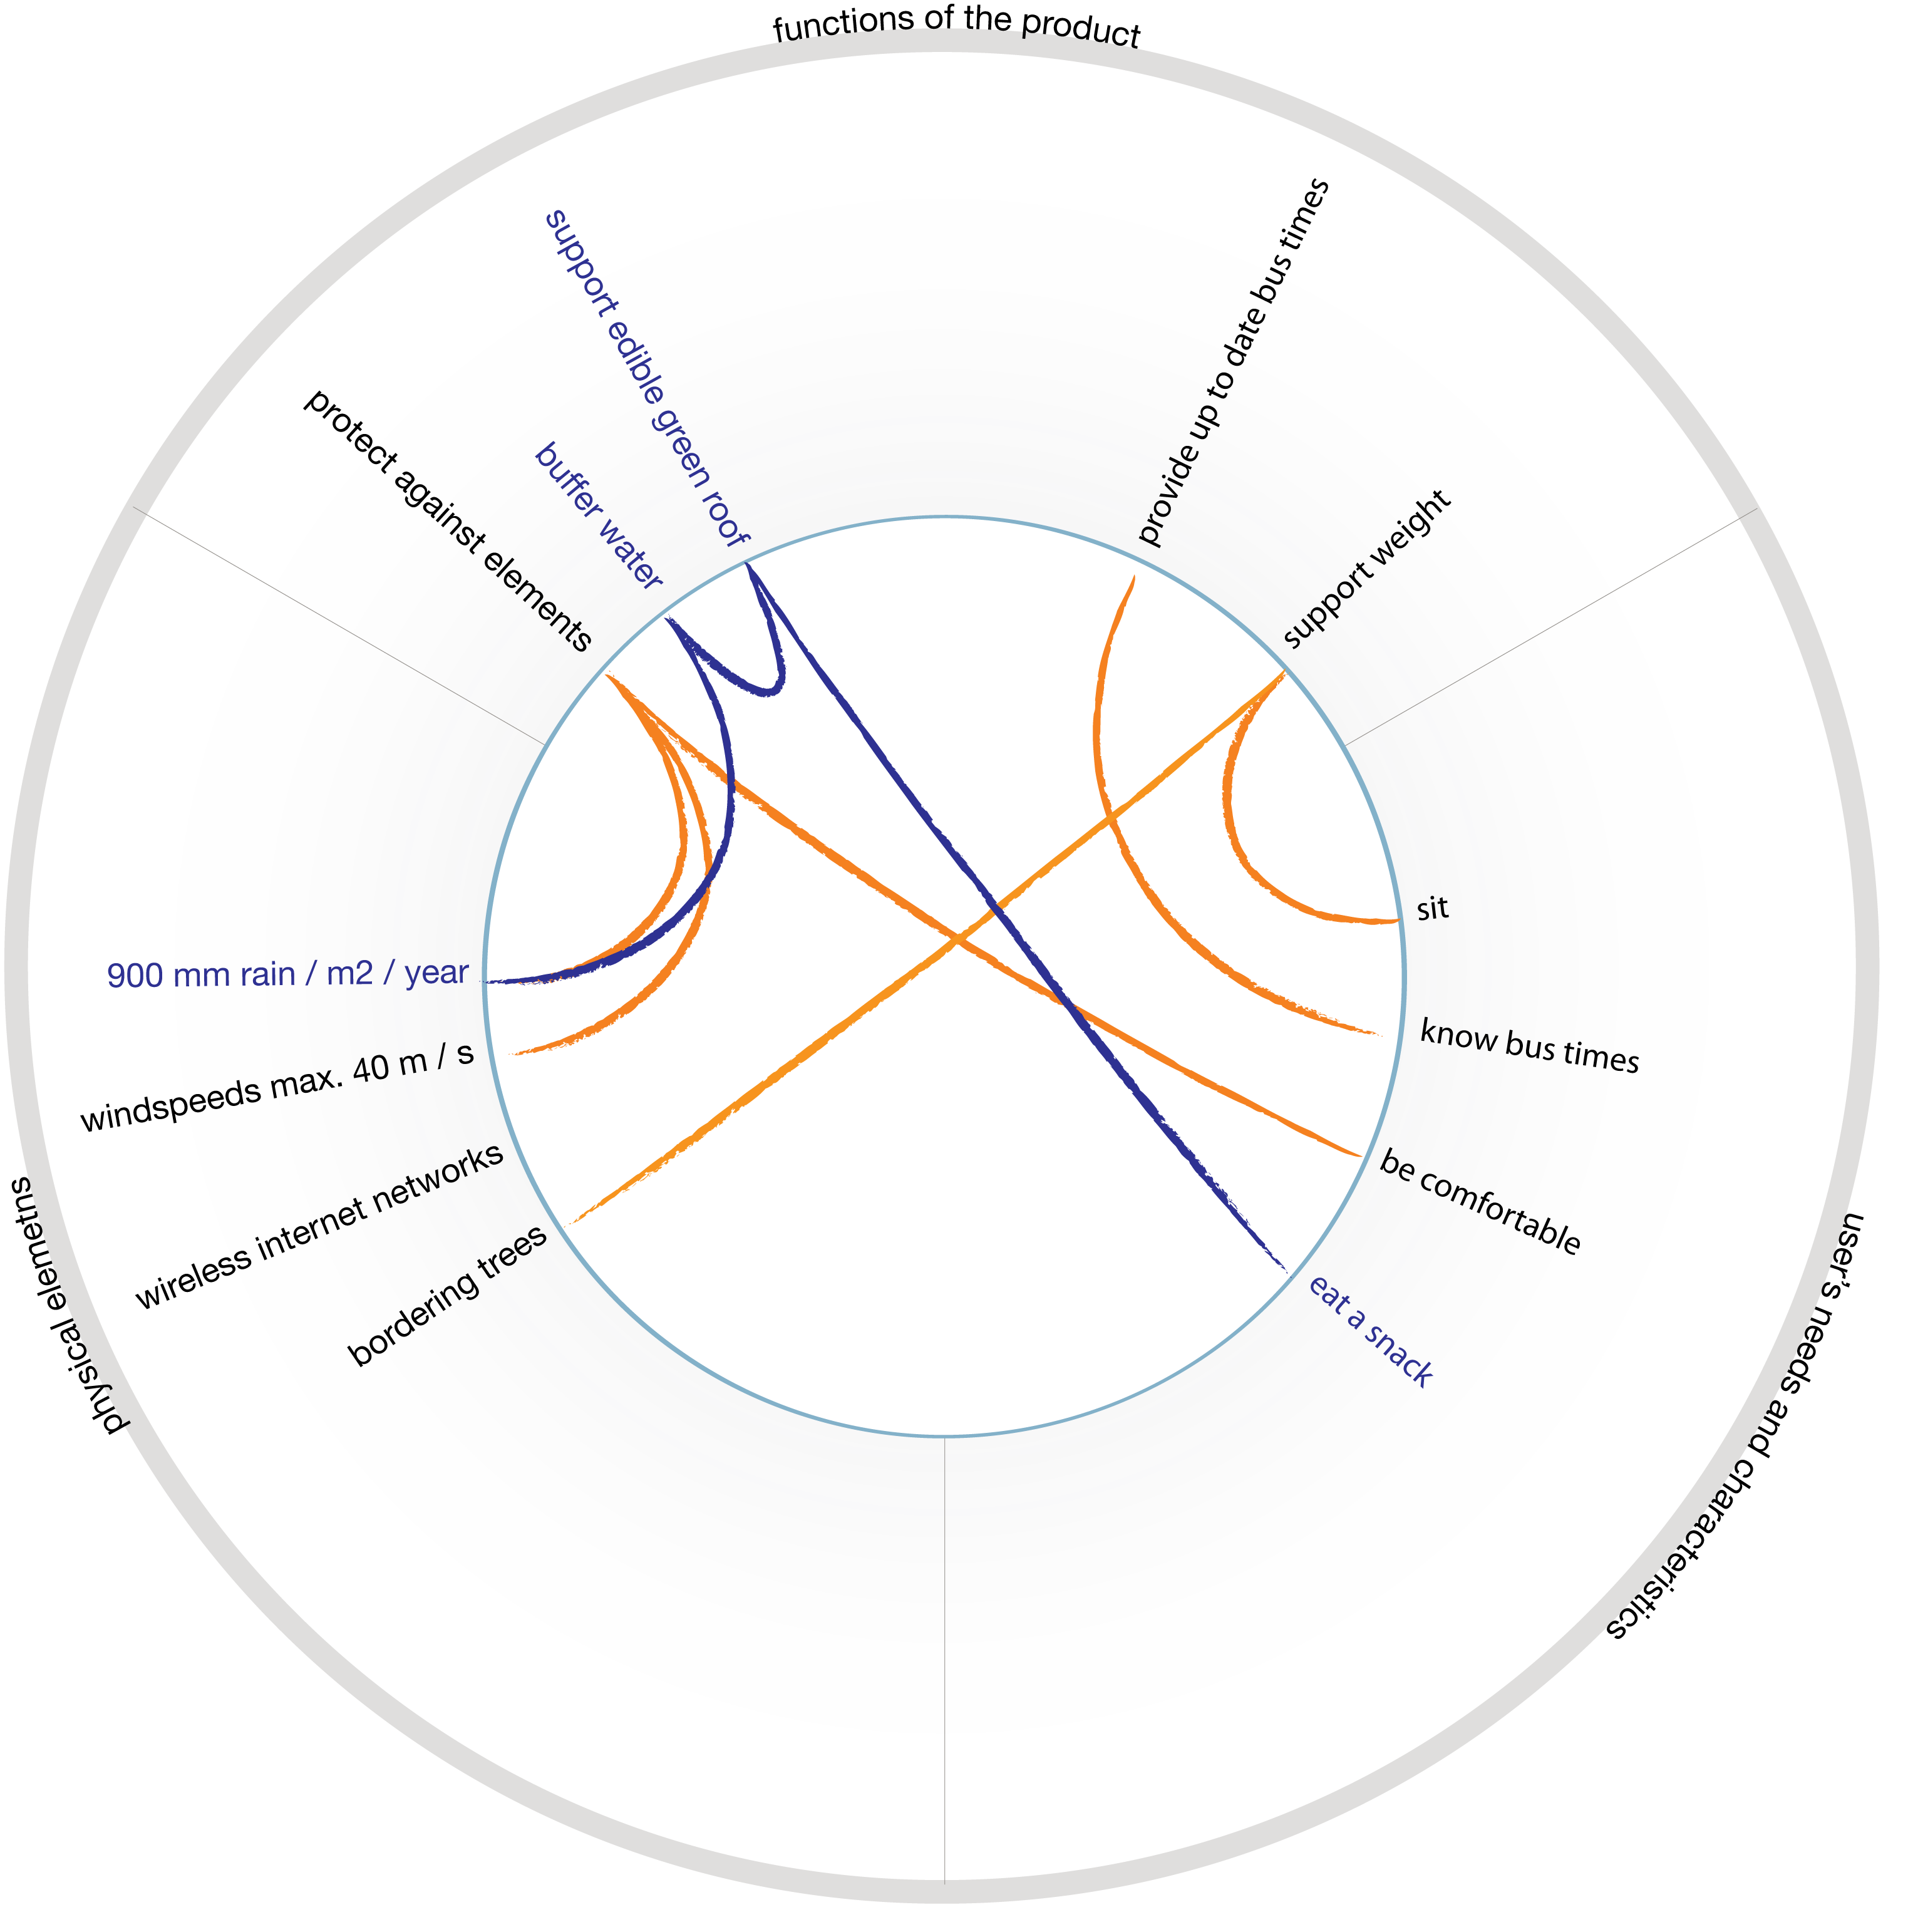
 In the synthesis phase, the connection diagram can be used to identify new connections that exemplify the life principles "locally attuned and responsive" and "leveraging interdependence". By finding new connections of the product with its environment, we improve how the product functions both from the viewpoint of the user as well as from perspective of the environment.
The first idea connects the bordering trees of the physical environment to the function of support weight of the bus stop which in turn is linked with the user function to sit.
We can increase the connectivity of the bus stop even more by introducing a new idea: incorporating the unfulfilled need of the user of eating a snack with the 900 mm rainfall via two new functions of the bus stop: buffer water and support edible green roof (left image, below). We can use the wind energy of wind speeds by introducing a new functionality of converting wind to electricity which in turn supports using the available wireless networks to provide up to date bus times (right image, below).
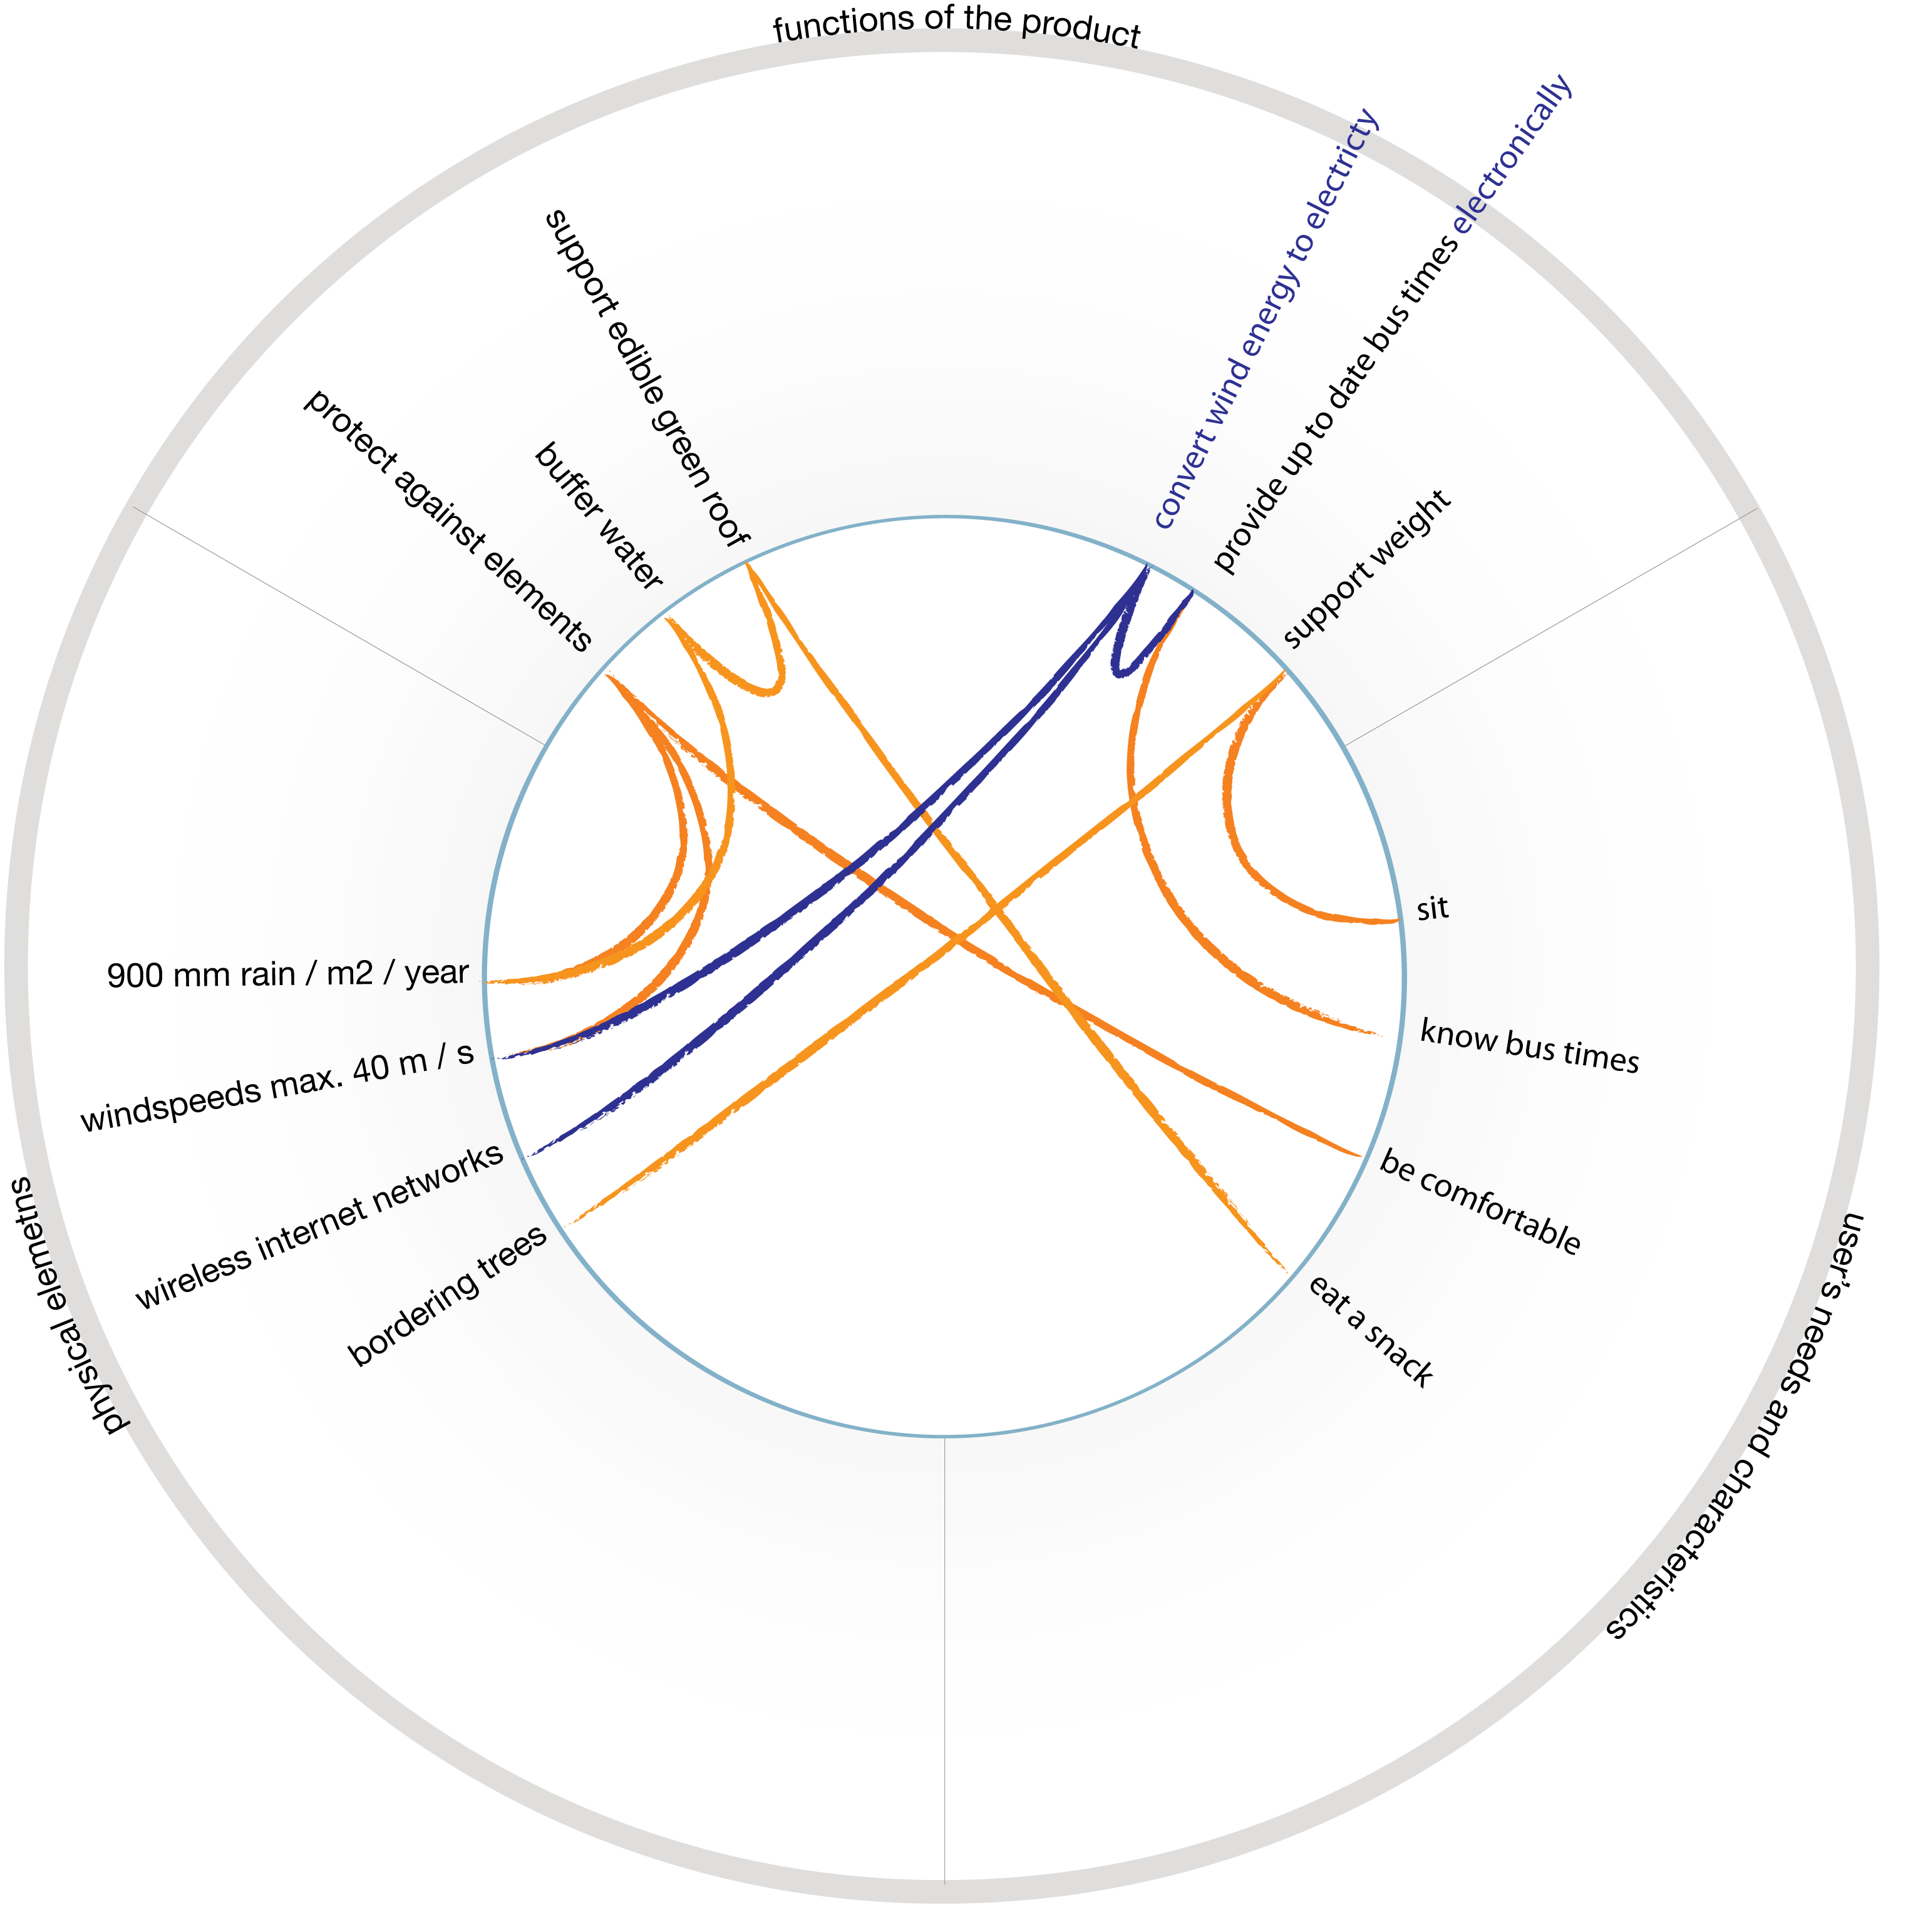
The bus stop has become entangled in its environment, providing functions for both the user and the physical environment. The result is an abstract description of a concept, expressed in its connections with the environment. Within the analysis phase, ideas can be generated to realize these functions using common creative tools supplemented with AskNature.
Evaluation by Designers
The usage of the diagram by industrial design engineers was evaluated in three workshops. Due to time limitations, a simplified version of connection diagram was used with only three categories: product functionalities, user characteristics/needs and physical environment. The main observations about the connection diagram were:
- The tool is mainly appreciated as an idea-generation tool.
- Resulting ideas are not necessarily perceived as sustainable.
- The resulting ideas were said to be surprising, as the tool demands a different approach to generating ideas.
- Ideas can become complex, as designers try to integrate as many actors as possible. Creating functionalities that stimulate mutually beneficial relationships remains difficult, and they may take more time to materialize.
- Opportunities in the environment remain unused when designers know few examples of existing strategies of organisms to connect with an environment.
- The quality of the ideas is dependent on the specific knowledge of a designer of a certain environment.
Summary
The main goal of the connection diagram is to evaluate the sustainability of a product in terms of its connectivity to its environment. The circular representation is suited to display a high number of connections in an orderly fashion. Future automatic integration of existing databases will render the application in projects more feasible. A digital diagram can introduce the opportunity to make ordinal measurements of the connectivity of a product.
Designers perceive idea generation as the main function of the diagram. As such, summarizing and linking actors is used as an activity to generate ideas for product functionalities. The quality of these ideas is dependent on the input of the environment scan. The tool is not necessarily perceived as increasing the sustainability of a product. This may be inherent to the type of ideas that emerge using this tool, but it could also be that connectivity is still a relatively unknown property of sustainability.
The diagram can be used throughout a product development process: in the analysis phase as a summary of important influences on the design, during conceptualization as an idea generator, and finally as an evaluation tool.
References:
- Krzywinski M. et al., ‘Introduction to Circos’ [Online]. - 2011. - March 14, 2009. - http://mkweb.bcgsc.ca/circos/.
- Mul E.J. Bio Inspired Design of an Electric Scooter Body [Book]. - Delft: Delft University of Technology, 2009.
- Remmerswaal H and Brezet J.C. Milieugerichte productontwikkeling [Book]. - Schoonhoven: Academic services, 2002.
- Roozenburg N.F.M. and J. Eekels Productontwerpen; structuur en methoden [Book]. - Utrecht: Lemma, 1998.
Image Credits:
- Gear and tools: © Fribourg - Fotolia.com
- Biomimetic tools: Ernst-Jan Mul
- Connection diagrams: Ernst-Jan Mul

Ernst-Jan Mul graduated in 2009 with an MSc in Integrated Product Design from the Delft University of Technology. Combining his interest in research, sustainability, biology and technology, he translated the sustainability paradigm of biomimicry into a structured design strategy. He works as a freelance bio-inspired designer since January 2010.
Creative Commons Attribution-NonCommercial-ShareAlike 3.0 License
Sustainable Innovation Network 2010-2012